
On Bubbles and Bitcoin
Hong Kong, 3 Dec 2017.
On bubbles and bitcoin
It seems everyone is writing their opinions on bitcoin and cryptocurrencies these days. While I don’t have any particularly special information to impart on the subject of bitcoin, having worked in the financial markets for nearly two decades I can share my thoughts on the question that I have been asked the most over recent weeks: Is bitcoin in a bubble?
What is a bubble?
We all feel we know what an asset bubble is, but a proper definition is a surprisingly difficult thing to nail down. Here are a few alternatives:
“When the prices of securities or other assets rise so sharply and at such a sustained rate that they exceed valuations justified by fundamentals, making a sudden collapse likely (at which point the bubble “bursts”).” FT Lexicon
“A bubble occurs when investors put so much demand on an asset that they drive the price beyond any accurate or rational reflection of its actual worth.” Investopedia
“A market phenomenon characterized by surges in asset prices to levels significantly above the fundamental value of that asset. Bubbles are often hard to detect in real time because there is disagreement over the fundamental value of the asset.” Nasdaq glossary
“The term bubble should indicate a price that no reasonable future outcome can justify.” Clifford Asness
“Bubbles are typically associated with dramatic asset price increases followed by a collapse. Bubbles arise if the price exceeds the asset’s fundamental value. This can occur if investors hold the asset because they believe that they can sell it at a higher price [to] some other investor even though the asset’s price exceeds its fundamental value.” Markus Brunnermaier, Princeton University
Many of these definitions include the mention of a crash or bursting of the bubble. This, then, would mean that it is impossible to define a bubble existed until well after it burst – a definition which some economists may agree with, but not one which is useful to a trader or investor involved in the markets at the time. Almost all the definitions of a bubble involve a concept of the fair value of an asset, a concept which can be tricky to nail down, and particularly so in the case of a cryptocurrency like bitcoin.
The fair value of bitcoin
If we need to know the fair value of something to decide if it’s a bubble or not, what is the fair value of bitcoin?
FT writer Gavin Davies wrote, on the subject of private currencies, “Decades ago, Milton Friedman established that, if private currency creation were to be permitted, then competing providers of new currencies would emerge until the price of the currency had been reduced to the marginal cost of its creation, which for paper currencies is close to nil.” This theory is backed up by the real-life experience of Somalia. After the government ceased to function and the central bank ceased to exist in 1991, local warlords produced reasonable quality counterfeit notes in the largest denomination (1000 shillings). The value of this note (both old originals and new forgeries) fell from $0.30 in 1991 to $0.03 – which was the cost of producing new notes. It then stabilized at that level, “the marginal cost of its creation”.
What, then, makes a bitcoin worth more than a 1000 Somali shilling note? Supporters will say scarcity, and they are correct in a technical way. There will only ever be 21 million bitcoins under the bitcoin protocol, although forks in the blockchain do effectively create new currencies like bitcoin cash. Moreover, the same scarcity claim cannot be made for other cryptocurrencies. If it is essentially free to create a new cryptocurrency, we could create more and more until all the ones with no real use or underlying value devalue to become completely worthless.
So what gives bitcoin its value? It’s usefulness? Hardly. Ripple and Litecoin are faster, and Etherium has a considerably larger scope for future development. Fiat currencies are easier to spend, and gold has a more solid history. In some ways, Bitcoin barely even functions as a currency. According to Bryce Coward at Knowledge Leaders Capital, it does not function effectively as a store of value, a unit of account or a medium of exchange. He concludes, “we think it’s appropriate to categorize bitcoin correctly as a speculative instrument that one day may be considered money. We are nowhere near that point now.”
During a bubble, it becomes common to value an asset using some new-fangled technique under the impression that this time is different. Stock valuations in the .com boom expanded to include measures such as USD per click or USD per eyeball. But how to value bitcoin? It generates no current or future cash-flow, unlike traditional assets. “Bitcoin has no underlying rate of return,” according to John Bogle, founder of Vanguard. “There is nothing to support bitcoin except the hope that you will sell it to someone for more than you paid for it.”
As Bogle points out, gold doesn’t create cash flow either so perhaps valuing gold and bitcoin are in effect the same challenge. The yellow metal at least has a cost of production (estimated to average around $1000-$1200 an ounce currently). Although this isn’t a price floor, a spot price below there for an extended period does act as a trigger for a reduction in supply as unprofitable mines close. Closing a bitcoin mine is easier, so it’s less of a stretch to say that the floor in the bitcoin price should be the mining cost, and this cost varies depending on the price of electricity and hardware. In a 2015 paper, Adam Hayes estimated that with global average electricity prices, mining costs would be $247 per bitcoin, and he expected that price to come down with hardware efficiency improvements and due to large commercial miners relocating where electricity was cheaper than the global average. Genesis Mining, a large mining operation which mines several cryptocurrencies in Iceland, estimates it’s cost of mining each bitcoin to be $60.
So a sensible floor to the price of bitcoin is perhaps in the range of $60-$200, a very long way away from current prices. What other valuation methodologies are there out there? Tom Lee of Fundstrat Global Advisors and Former Venture Capitalist Ryan Selkis have both attempted to develop some sort of valuation method, and have suggested valuations of $25,000 and $50,000 respectively (albeit in the distant future). However, both their methodologies involve picking a number for the monetary base of bitcoin arbitrarily and calculating what bitcoin rate that implies. Instead of guessing the value of one bitcoin (from which the market cap of all bitcoins can be calculated), they are guessing the future value of the market cap of all bitcoins and then calculating the value of one bitcoin from there. Hardly an improvement in valuation methodology.
If there is no sensible and widely accepted valuation methodology out there, who is to say whether bitcoin (or any other cryptocurrency) is actually undervalued or overvalued? That surely makes calling a bubble very contentious. Having said that, it must be assumed that with no available valuation methodology, investors are buying without a second thought about what the valuation should be, and this is one of the classic signs of a bubble (more below). As The Economist summarized in a recent article, “People are buying Bitcoin because they expect other people to buy it from them at a higher price: the definition of the greater fool theory”.
What is a bubble (revisited)?
So defining a bubble in terms of valuation appears to be a thankless task for an asset with no established method of valuing it.
When John Authors opined in the FT on the subject of spotting market bubbles, he borrowed a famous phrase from US Supreme Court Justice Potter Stewart: “I know it when I see it”. This is perhaps not as daft as it sounds – there is a definite pattern to a bubble, best viewed in the charts.
The prototypical bubble from the textbooks is often drawn like this:
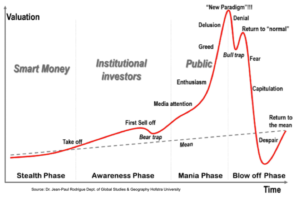
A look at the charts of past bubbles does show an uncanny similarity to this prototype. Exponential growth is nearly always a feature, and the bear trap and bull trap turn up with remarkable frequency. In fact, the charts that follow look so similar to each other it is sometimes difficult at first glance to tell which is which. Here are some famous episodes of the past: Dow Jones 1929, Gold 1980, Nikkei 1990, Nasdaq 2000, Shanghai Comp 2007, and (just in case you thought that people actually learn from their mistakes), Shanghai Comp again in 2015.
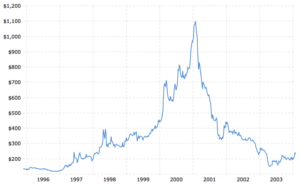
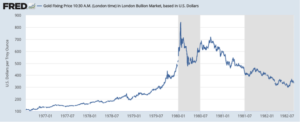
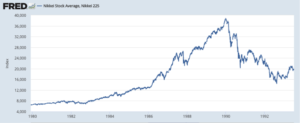
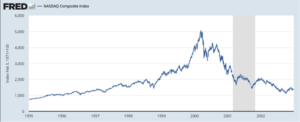
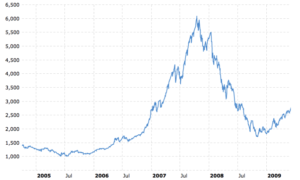
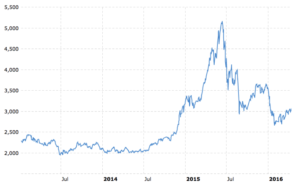
Again though, there is the feeling having seen the charts, the full picture involves not just the climb but also the crash afterwards. So a bubble, and particularly a bubble top, is difficult and perhaps impossible to identify in the heat of the moment. Perhaps it is better to consider the conditions for a bubble to occour to gain an insight into when and where they might appear, and see what light this casts on bitcoin.
The causes of bubbles
There has been some academic research done on the causes of bubbles, and there are a few features that stand out as being present time and time again.
The American economist Hyman Minsky came to attention after the 2008 crash for his studies of the credit cycle. In many ways, his explanation is a description of the prototype bubble in the graph above. In Minsky’s view there are five stages of a cycle:
- Displacement – new technology or new investment paradigm.
- Boom – prices rise slowly, then media attention brings more buyers.
- Euphoria – exponential prices, greater fools, overvaluation.
- Profit Taking – smart money gets out, credit dries up, a Minsky Moment.
- Panic – margin calls and liquidation.
Many commodity bubbles start off with the very sensible idea that the supply/demand balanced has changed, a Displacement in Minsky’s cycle, and the price rises steadily until the speculators turn up en masse and accelerate the price move. Supply shocks include:
- The two big OPEC oil hikes of the 70s,
- The flooding of Cameco’s Cigar Lake mine in 2006 which started the Uranium price surge, and
- The truck driver strike in Siberia that halted Palladium delivery and initiated the big move in 2000.
- Any incident you can think of where bad weather ruined a soft commodity crop and prices went wild for that season.
In these cases, the market started moving higher for very sensible reasons but got pushed higher by momentum traders and other speculators before finishing in very overheated territory.
In equities, bubbles are often started with a Minsky Displacement in the form of a new development or invention which causes great excitement amongst investors. Examples include Railway Mania in the UK (1846) and USA (1857), the widespread adoption of electricity and automobiles (to 1929), and the TMT bubble (to 2000). In this case, the move often starts with (as the prototype graph suggests), smart money predicting some future value where none existed before. This is followed by institutional investors putting money to work based on higher and higher expected valuations of the fledgling industry. In the final stage, slow-moving investors and members of the public become aware of the news through the media, and, in the main, invest without proper regard for value. This, as mentioned before, is one of the hallmarks of a classic bubble.
Looked at through these glasses, there are some obvious and easy comparisons to make between the dotcom boom and the recent crypto craze. During the dotcom (crypto) boom, the internet (blockchain) was the major new invention. Even those who were not bullish on stocks (tokens) generally admitted that the exciting new technology would change the world, even when they doubted the valuations of the companies (tokens) involved. Established, everyday companies found they could multiply their share price with the addendum .com (blockchain) on their name. New companies with even the flimsiest business plan (white paper) found that they could arrange an IPO (ICO) quickly and owners could sell out for remarkable valuations.
Aside from the initial causes of a big move, researchers have found another vital ingredient to a bubble: there is a strong link between financial liquidity and the occurrence of bubbles. Here the Minsky Displacement can be lower interest rates / easier alternative liquidity conditions such as QE, or an increase in leverage due to a loosening of some financial restrictions. Gunduz Caginalp has conducted many lab experiments on this subject, (one example here) which support the idea that greater cash liquidity compared to asset prices increases the size of a test bubble.
This theory of extra money chasing certain assets and causing bubbles fits in with what we know about the history of investing.
- The price rises in commodities in the 70s, which culminated in the gold and silver bubbles of 1980, had its origin partly in the OPEC oil price hike, but also partly in the monetary expansion that followed Nixon’s departure from the Bretton Woods gold peg in 1973.
- Loose BoJ policy of the early and mid-80s led to increased liquidity in Japan, and this was compounded by new financial engineering and accounting practices such as zaitech which freed up more corporate money for speculation. This, of course, resulted in the twin property and stock bubbles which climaxed in 1990.
- Massive Fed liquidity over the turn of the century to smooth markets on Y2K day gave the last big kick higher to an already overvalued Nasdaq.
- USA interest rates were still at 1% in June 2004, 2.5 years after the end of the recession, and were raised very cautiously thereafter. This excess liquidity sowed the seed for the next bubble, in US real estate.
- Global central banks have poured even more fuel on the fire during this cycle, from 2009 on, with zero or negative interest rates and massive QE in all the major developed countries of the world simultaneously. Conditions have arguably never been more perfect for the creation of a bubble, and one suspects that the history books of the future will be able to report on several confirmed bubbles, Minsky Moments, and crashes over the coming years. Will bitcoin be one of them?
How to trade a bubble?
If, as seems likely, bitcoin is in a bubble, how is the best way to trade it? There is a lot of money to be made from buying when a bubble is expanding and then selling at the top. But bubble tops are notoriously difficult to spot in advance and in times of greed over fear, speculators find it easier to get in than get out.
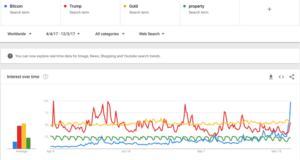
On the subject of buying into a bubble, Charles Kindleberger, a historian of bubbles and noted author, wrote, “There is nothing so disturbing to one’s well-being and judgment as to see a friend get rich.” Social media and anecdotal evidence from friends tells me that the fear of missing out is very strong in the current climate. On Google, “bitcoin” has recently overtaken “property”, “gold”, “Trump” and even “Kardashian” in search popularity. This probably means there are more buyers in the here and now as retail investors are doing their research, but it also brings us closer to the time when everyone is long and there are no greater fools left.

When it comes to selling a frothy asset, it is useful to remember the story of Sir Isaac Newton, not a stupid man, and his trading efforts at the time of the famous South Sea Bubble of 1720. He failed to spot the top of that bubble, and it wouldn’t surprise me if many of today’s investors will suffer from the same issue when the time comes.
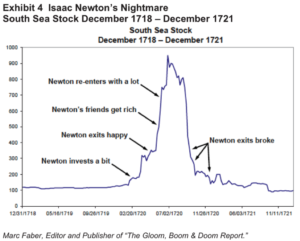
We are clearly in the phase of the bitcoin expansion where the public are investing: Minsky’s Euphoria phase or the “mania” phase on the earlier prototype. But where are we on the mania path of Media Attention, Enthusiasm, Greed, Delusion, and New Paradigm? I have certainly seen at least three or four of those in recent weeks. I will not pretend that I can predict the timing of a bubble top, but after 18 years in the financial markets, there are a few things I would watch out for when trying to prepare for the peak.
Firstly, volatility increases at extreme turning points, both peaks and troughs. When I was a very new trader working on the NatWest London FX floor in early 2000, I remember seeing the Nasdaq fall 9% in the NY morning only to rebound 9% in the afternoon. To see America’s second-biggest stock market change in value so fast must have had some investors reaching for the bucket and then reaching for the door, and sure enough, the apogee of the market was printed within a month. Almost the same thing happened in 2015 – I was long China stocks from the very start of the bull run. I sold some rather too early, but still had a decent position on when I saw the Shanghai index go from a 2% daily beast to a 10% daily beast. A normal investor should not be investing in something that moves 10% a day, I thought, and it seems more than a few other participants agreed. I was lucky enough to sell the last of my holding at a rate remarkably close to the high. Bitcoin already moves at a huge level of volatility and has done for most of its life. Still, an increase in volatility from already high levels should be a sign for sane investors to head to the sidelines or at least lighten up.
The second sign I can point to which occours at extremes is to be found in the press. If one of the major (non-financial) newspapers ever puts a story about the stock market, the price of gold, or the USD on its front cover, that is a reliable sign that the end of the trend is nigh. Newspapers, after all, are reporting on what has happened in the past, not in the future. So a front page story is a report of an extreme relative to previous prices, not a prediction of things to come. If bitcoin is mentioned on the front page of USA Today, The Sun, or The Herald Sun, it’s safe to assume that everyone who is likely to buy crypto has bought it already.
The last piece of advice I can give on this subject of owning in a bubble is this: don’t forget about portfolio rebalancing. Regardless of how bullish anyone is on crypto, and what their dream valuation is, an investor should have a balanced portfolio. If a percentage of that portfolio was allocated to bitcoin when the price was $5000, half of it will need to be sold at $10,000 to keep the portfolio in line with the original balance. This is common sense to any disciplined investor, but it is important to remember that rebalancing should be done more regularly when assets are moving around at something like 30% a week!
To finish
To all those who are long with the trend, congratulations so far, don’t forget to rebalance your portfolio and good luck with spotting the top. You will need it.
For those thinking of going long at these levels, remember the fifth rule of legendary Merrill Lynch strategist Bob Farrell: ”the public buys most at the top and least at the bottom”. And be mindful of Warren Buffet’s famous advice, “try to be fearful when others are greedy, and be greedy only when others are fearful”.
And for those waiting for the crash, don’t short too soon. The most relevant quote here is also from Bob Farrell. His fourth rule is: “Exponential rapidly rising or falling markets usually go further than you think. But they do not correct by going sideways.” In fact, the more I think about it, this is not just advice for the bears. This is solid advice for all traders and investors in this historic bitcoin bubble.
Receive updates by email


On Bubbles and Bitcoin
/0 Comments/in blog, Finance and economics, Financial Markets, Investing /by Andy+China’s Balancing Act
/0 Comments/in blog, Economics, Uncategorized /by Andy+FAANGs for the Memories
/0 Comments/in blog, Financial Markets /by Andy+